How video data helps build successful video products faster?
February 26, 2026
10 Min
Video Data
Share
This is some text inside of a div block.
Join Our Newsletter for the Latest in Streaming Technology
Thank you for Signing Up
“Our engineering teams learn little to nothing when users complain ‘video is buggy’ or ‘video does not work.’”
That was the frustration shared by the CTO of a fast-growing creator app with over 300,000 daily active users.
To a user, the complaint is simple. To engineering, it’s almost unusable.
What failed?
Was it content processing?
A player regression?
A CDN edge?
A specific Android device?
A network fluctuation?
Engineering teams don’t control networks or devices. But they get blamed anyway.
Once those complaints move from support tickets to public app reviews, it stops being a technical issue. It becomes a growth problem like retention drops, NRR weakens and acquisition gets harder.
Most video platforms hit this wall. They have logs. They have infrastructure monitoring. They have product analytics. What they don’t have is session-level visibility into what actually happened inside playback.
And without that, there’s no way to go back and understand where the experience broke.
This is where video data comes in. At a technical level, it shows what actually happened inside playback. Startup delays, buffering spikes, bitrate drops, player errors, crash correlation tied to real sessions instead of vague complaints.
But this isn’t just an engineering tool. When video is central to your product, playback quality directly impacts revenue.
If startup time increases, engagement drops.
If buffering creeps up, churn follows.
If preview content fails, conversions suffer.
If live streams lag, trust erodes.
Video data connects experience to outcomes. It shows which content actually holds attention. Which regions struggle. Which devices misbehave. Which audience segments stick around and which ghost you.
Instead of arguing in Slack about whether it’s the CDN, the player, or “just bad WiFi,” you see where technical quality intersects with retention, conversion, and growth.
And no, you don’t need to rebuild your stack. FastPix Data SDKs plug straight into players like Shaka, AVPlayer, and AndroidX Media3 and more… They integrate to your existing playback events and start streaming structured session data in minutes.
You can just keep building. Now you just know what’s really happening. Which is surprisingly rare in video.
TL;DR
When users say “video is buggy,” it’s almost impossible for engineering teams to know what actually went wrong without session-level visibility. This article explains how video data reveals real playback issues like startup delays, buffering, device-specific failures, and release regressions and how those insights connect directly to retention, revenue, and growth. With tools like FastPix Video Data, teams can capture structured playback data in minutes and finally understand what’s really happening inside video sessions.
So what metrics are we actually talking about here?
Not surface-level analytics. The metrics that tell you whether playback quality is affecting retention, revenue, and system stability.
But raw metrics alone don’t solve daily complaints. The value comes from understanding how those signals translate into decisions, what to fix, what to prioritize, and what to ignore.
That’s why we’ve structured this into two clear sections: business impact and technical insight. One helps you understand how video performance influences growth and retention. The other helps you isolate regressions, performance bottlenecks, and release risks.
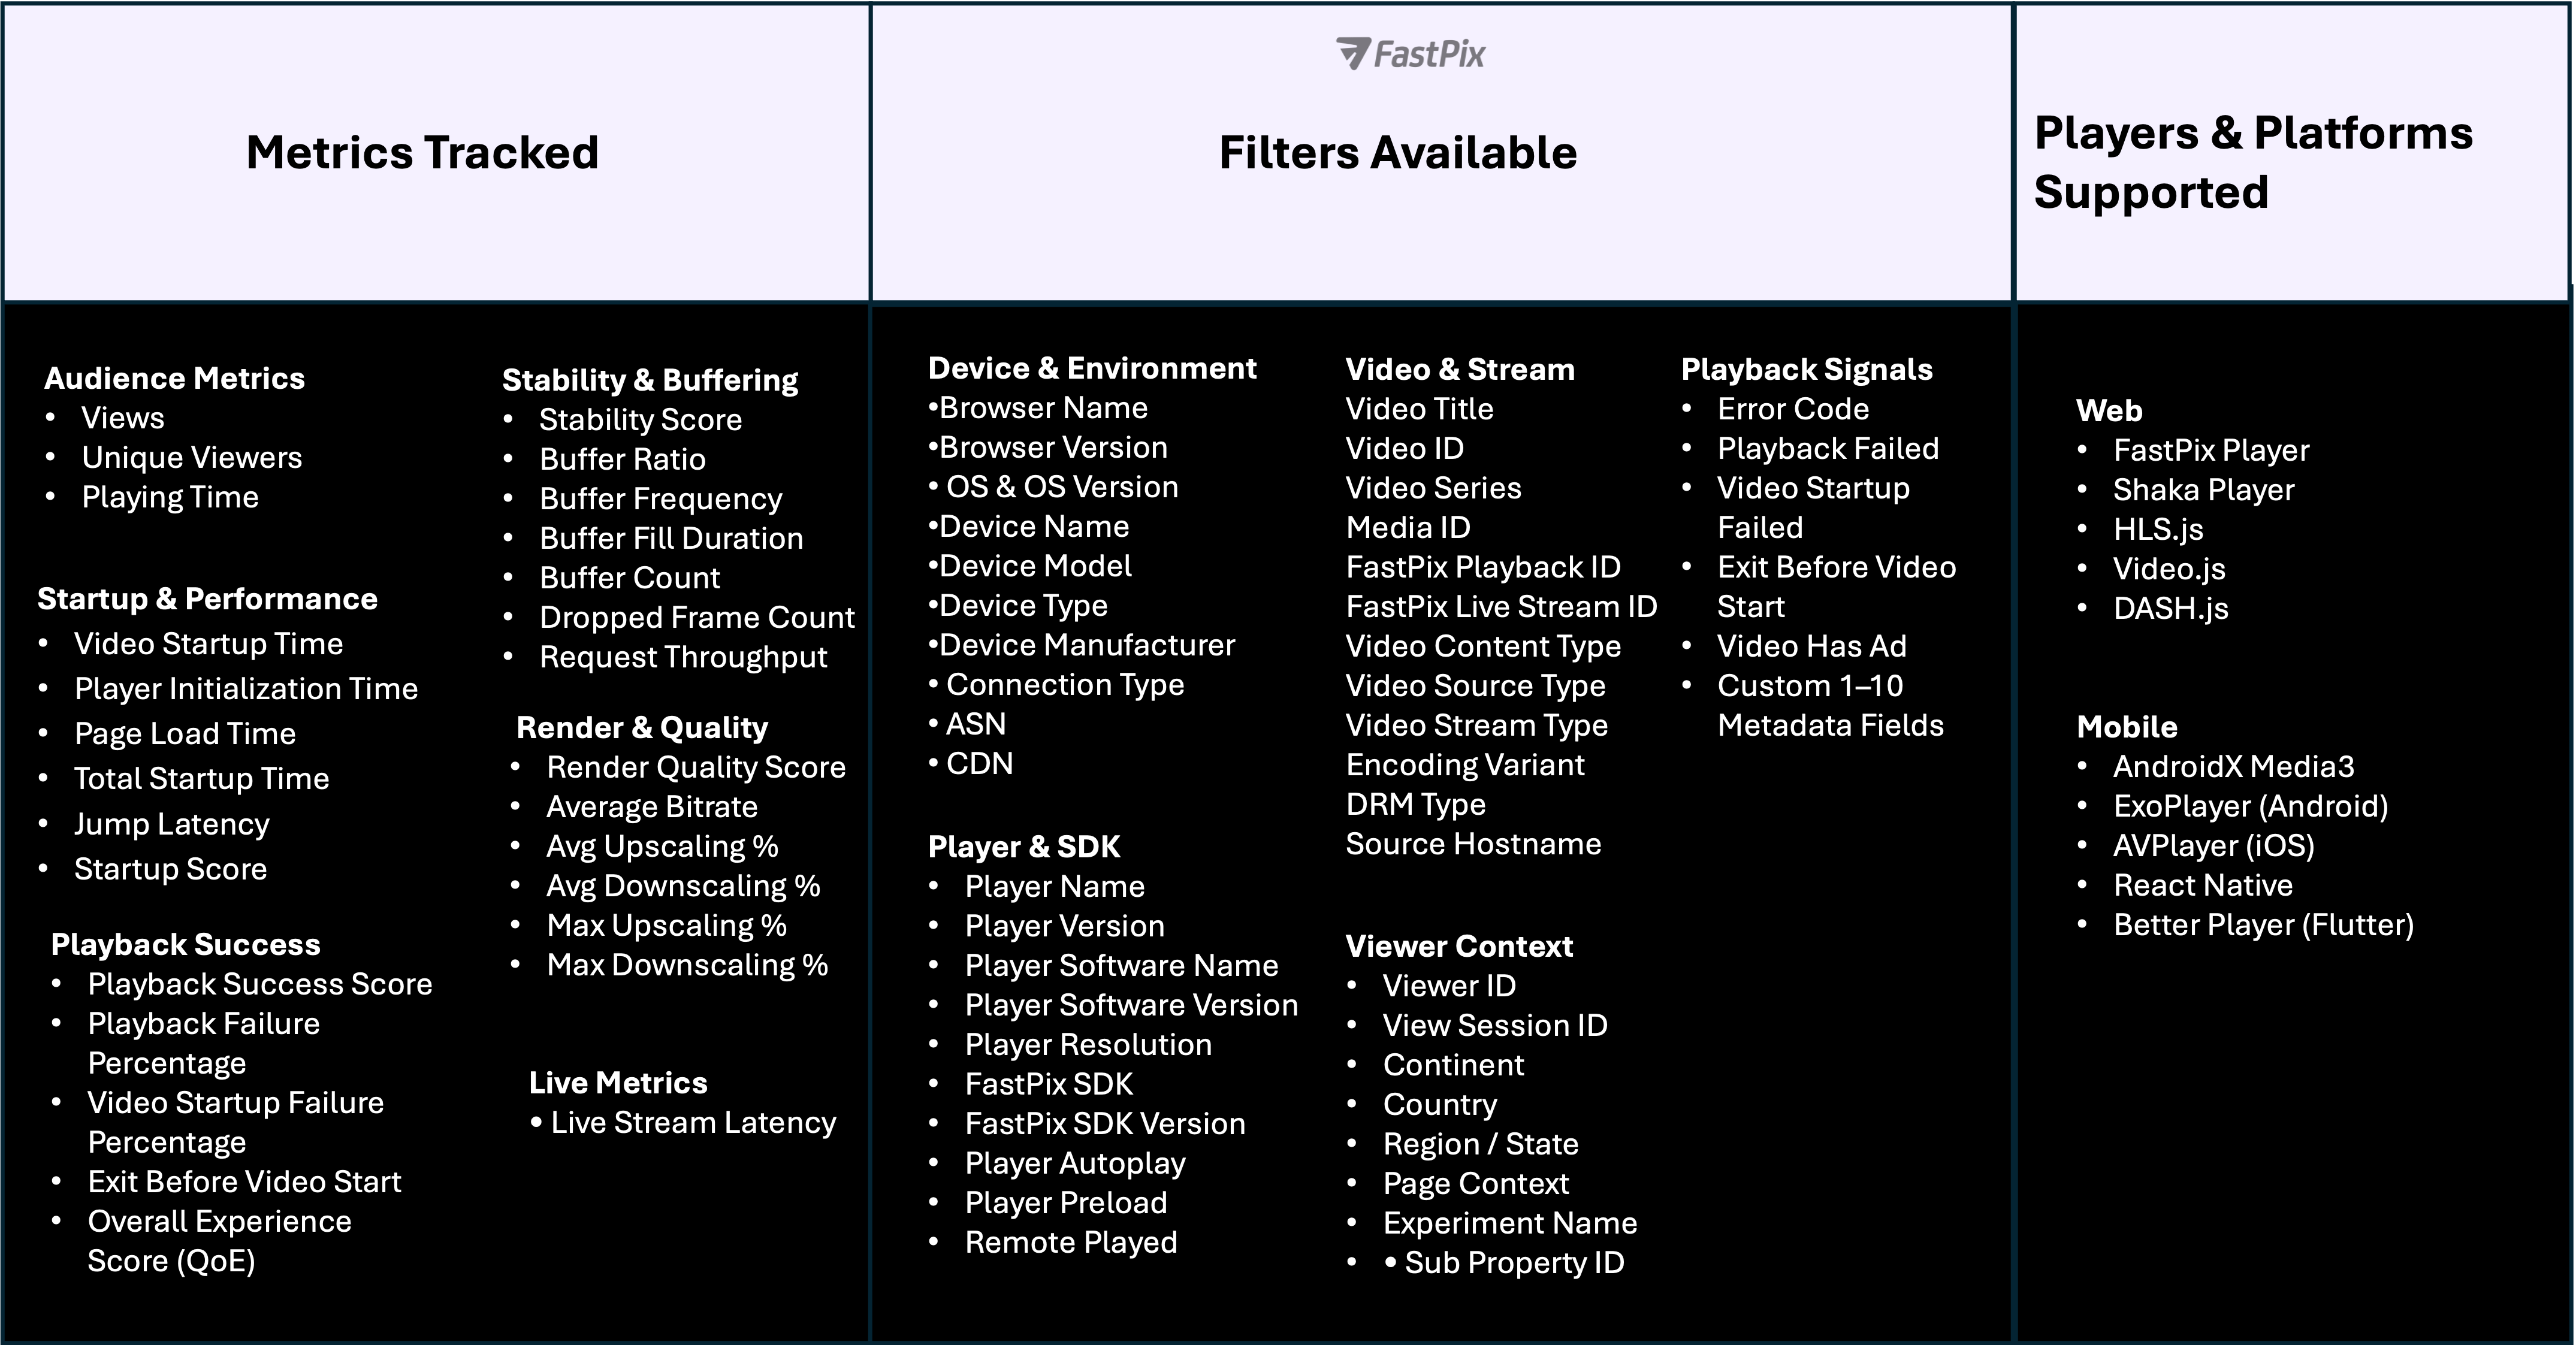
Below is the set of metrics we track.
Note: We track more than 50+ metrics, refer to our docs on What Video Data do we capture to get the full picture of it.
Now let’s connect those metrics directly to the decisions you need to make.
How Video Data Shape Business Decisions
When video plays a direct role in revenue, view counts alone don’t give the full picture.
Views tell you that someone clicked play. They don’t show whether learners stayed engaged, returned later, or found enough value to continue. Relying only on view counts makes it harder to understand what’s truly working and where improvement will have the biggest impact.
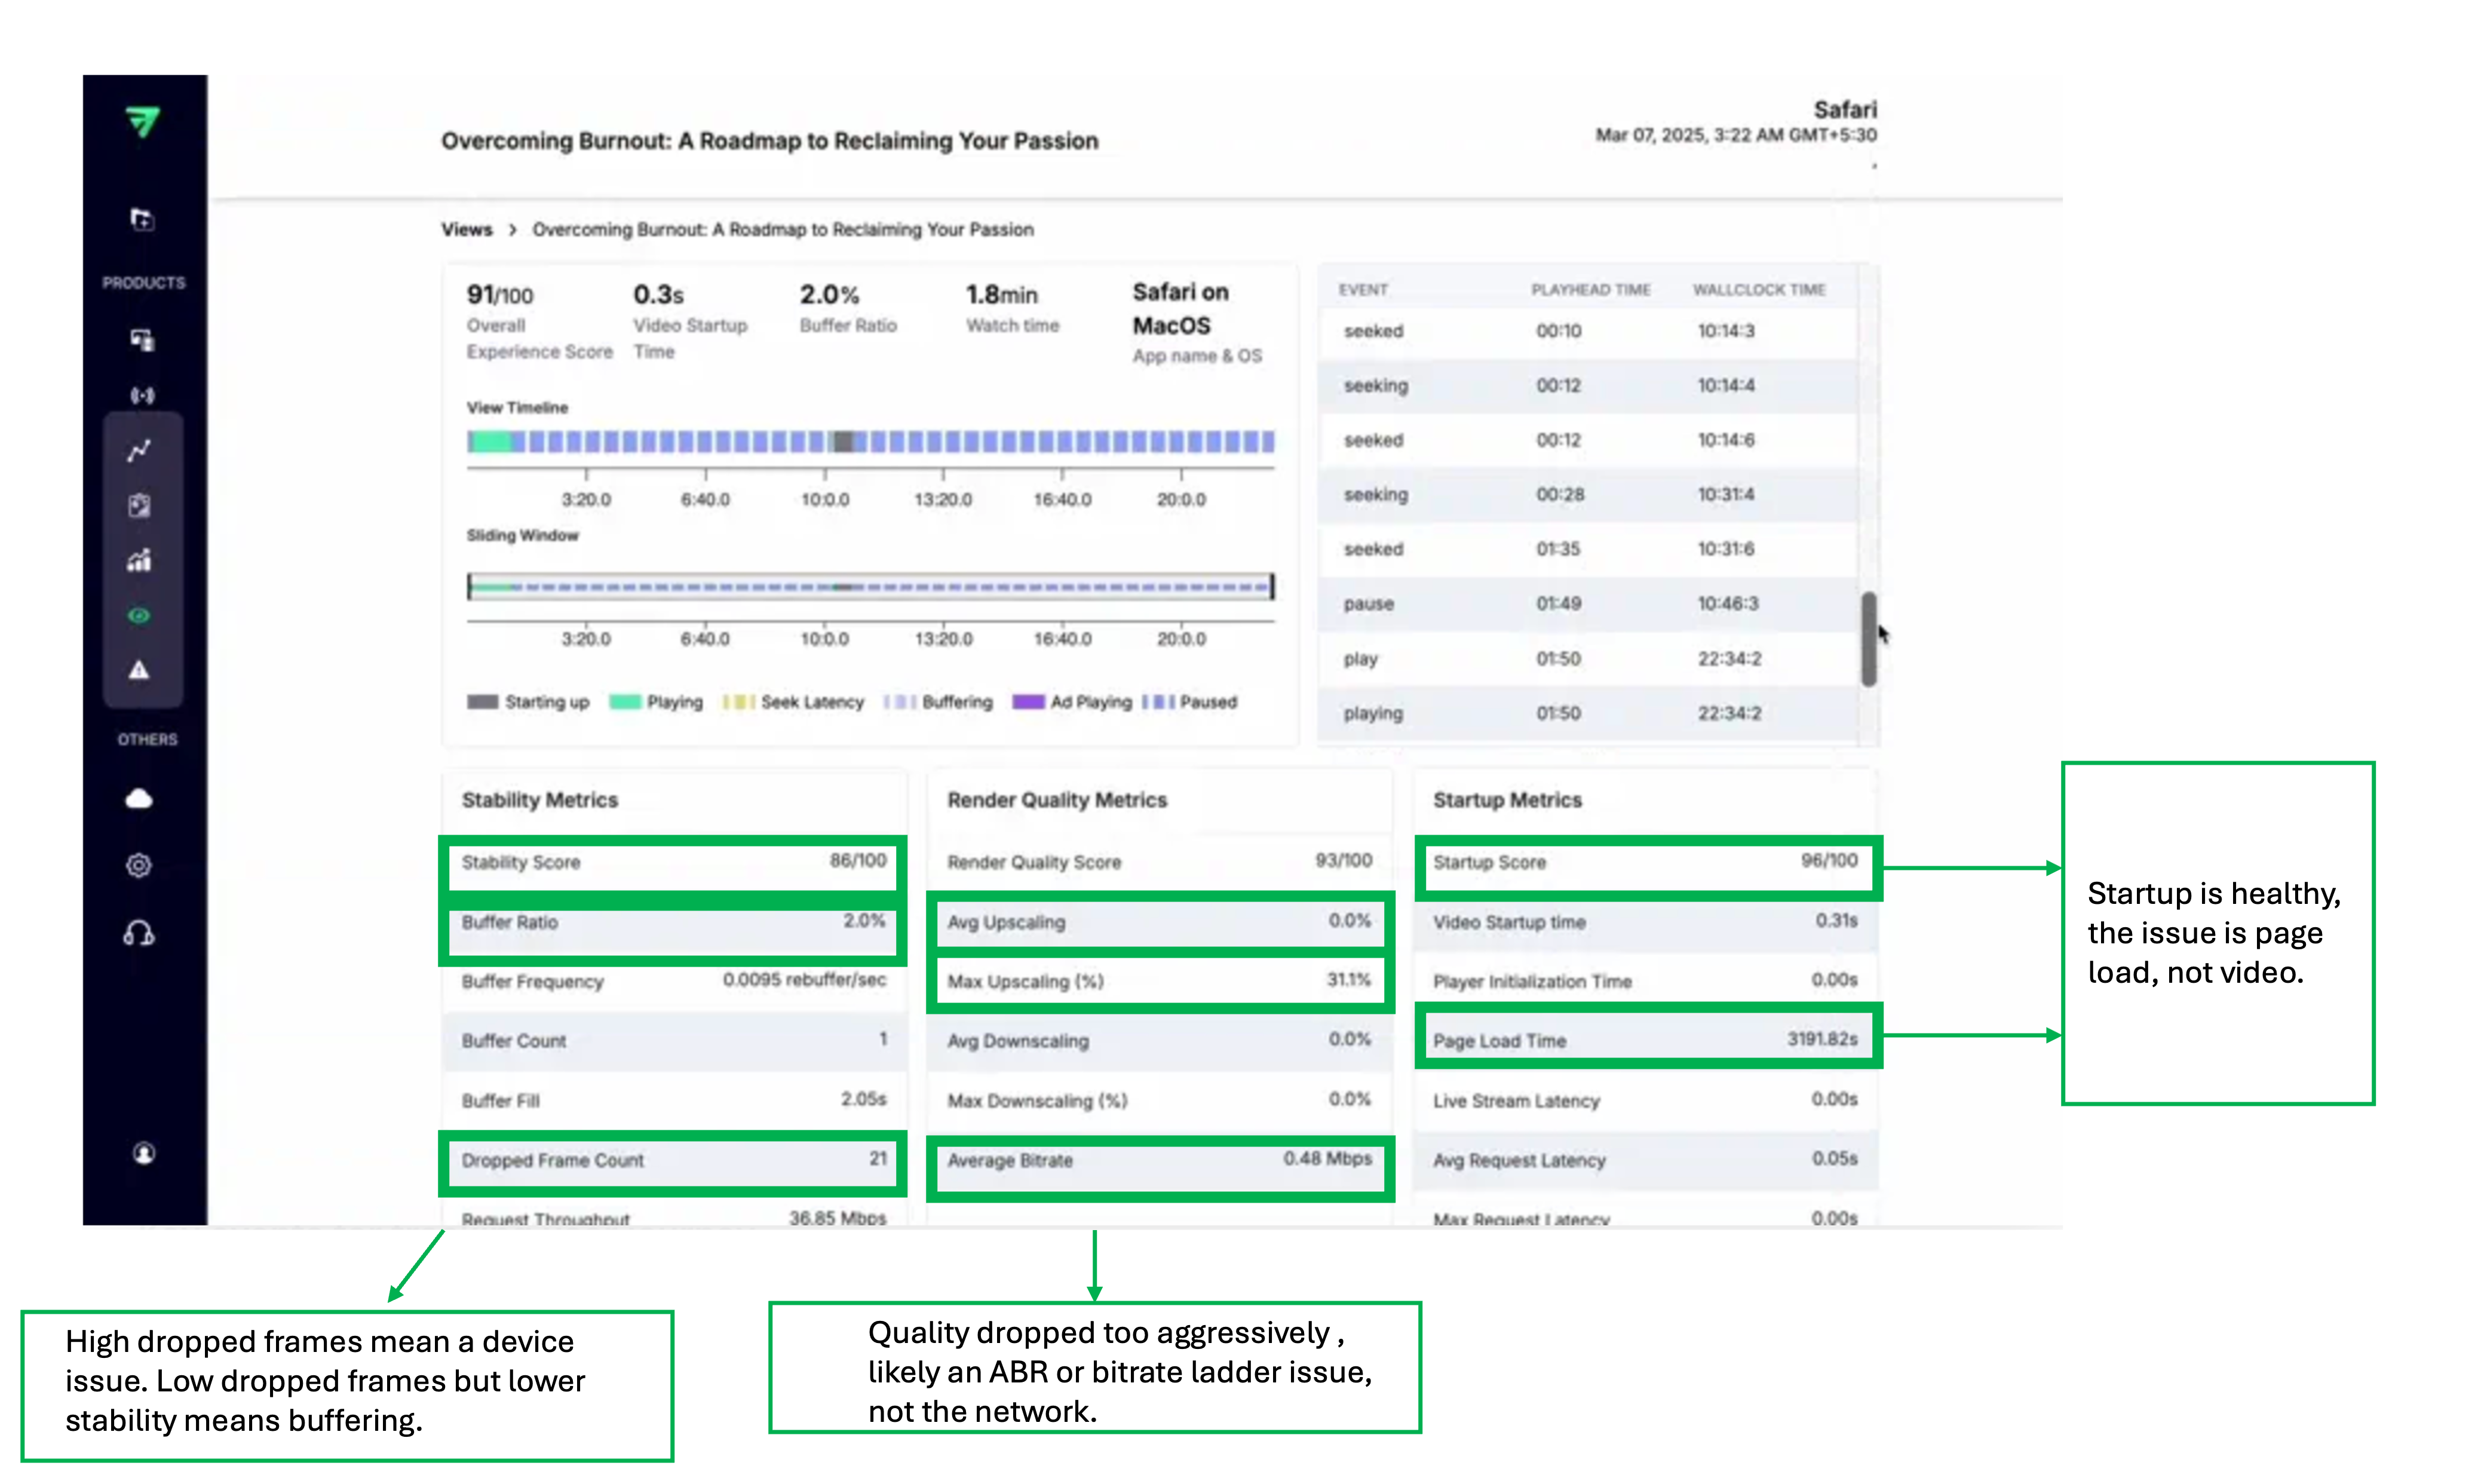
Let start with one example with the dashboard:
Look at how just a few metric pairs and the story becomes clear.
Startup Score is high and Video Startup Time is fast, but Page Load Time is heavy. That tells you immediately the delay isn’t video delivery. The player is fine. The page is slow.
Average Bitrate is low while Max Upscaling spikes. That means quality dropped and had to be stretched back up. This points to ABR or bitrate ladder tuning, not bad networks.
Stability Score dips with dropped frames present. That suggests device-side rendering pressure, not just buffering.
Just a few metrics, read together, already explain what’s happening.
Now let’s look at more scenarios and see how video data helps in each one. To make it clearer, we’ve grouped them into focused sub-categories.
1. Engagement & Retention
These questions tell you whether viewers are staying or quietly leaving.
Business Question
FastPix Metrics to Analyze
What This Helps You Decide
Which videos truly hold attention?
playing_time, view_completed, views
Which content to promote more and which to deprioritize
Are users finishing videos?
view_completed, exit_before_video_start
Whether drop-offs are content-driven or startup friction
Are we attracting new viewers or retaining existing ones?
views, unique_viewers
Whether growth is repeat consumption or one-time traffic
Beyond standard video metrics, FastPix Video Data can be tailored around what you actually care about. Along with standard playback signals, teams can add their own business context to each video session and filter the data around the things that matter most. FastPix lets you enrich each session with platform-specific metadata.
Below are examples across industries.
1. By User Segment
Customization Dimension
Example Fields (Video Business)
What This Helps You Decide
Viewer tier
free / premium / VIP
Whether premium users are getting a better experience than free users
Audience type
new_user / returning_user / subscriber
If playback issues are affecting retention
Buyer persona
student / instructor / viewer / creator
Which user groups face the most playback friction
Enterprise account
reseller_id / partner_id
Whether specific partners are seeing more quality issues
2. By Monetization Model
Customization Dimension
Example Fields
What This Helps You Decide
Revenue type
subscription / ads / PPV
If ads or paywalls are increasing buffering or exits
Campaign ID
campaign_code
Whether paid traffic lands on a stable video experience
Content paywall
preview / full_access
If preview performance affects conversion to paid
Revenue share partner
creator_id / instructor_id
Whether top revenue contributors are impacted by QoE issues
3. By Geography & Distribution
Customization Dimension
Example Fields
What This Helps You Decide
Region
country / state
Which markets need delivery improvements
ISP / ASN
network_provider
If certain networks cause repeated buffering
CDN routing
primary / backup / reseller_cdn
Whether routing strategy affects stability
Language stream
dubbed / localized
If localized streams perform differently
4. By Content & Publisher
Customization Dimension
Example Fields
What This Helps You Decide
Creator / Instructor
creator_id / instructor_id
If specific creators are losing viewers due to playback issues
Content type
live / VOD / short-form
Which formats are more sensitive to performance issues
Event ID
match_id / webinar_id
If live events need extra performance monitoring
Series / season
season_id
Where viewers drop across episodic content
5. By Release & Engineering Rollout
Customization Dimension
Example Fields
What This Helps You Decide
App version
build_number
If a release introduced startup delays or errors
Player version
sdk_version
Whether a player update caused regressions
Encoding profile
ladder_id
If bitrate changes improved or hurt performance
Feature flag
experiment_group
If an experiment degraded playback quality
Now let’s move to the engineering section.
How Video Data Helps with Technical Insights
At scale, video issues are rarely clean or obvious. Playback might work on one device and fail on another. It may start instantly in some regions and stall in others. Quality can degrade mid-session or crashes can appear only on specific app versions
This is what makes video hard to operate in production. The system is distributed by nature spanning players, devices, networks, CDNs, and backend services and failures tend to affect only slices of traffic.
Because of that, engineering teams don’t debate on overall availability. They focus on understanding where the experience breaks, for whom, and under what conditions.
Whether latency or buffering is degrading live sessions
Drop-offs during peak events
playing_time, view_completed (filtered by time window)
Whether viewers abandon during load spikes
Is CDN struggling under load?
cdn, buffer_ratio, video_startup_time
Whether delivery degrades under traffic
Sudden quality drop during live
avg_downscaling, average_bitrate
Whether bitrate instability increases during concurrency
Customize your technical metrics
Just like business teams tailor video data to answer questions about engagement and revenue, engineering teams can do the same on the technical side. Instead of relying only on generic playback metrics, FastPix lets teams attach technical context that reflects how their system is actually built and deployed.
On the technical side, teams commonly customize video data with things like app version, build number, player version, CDN or delivery path, or even specific backend services involved in playback. Once this context is attached, engineers can slice video performance by release, rollout, or infrastructure change and immediately see what’s affected.
This makes it possible to answer questions engineers care about during real incidents.
How Easy It Is to Get Video Data Live with FastPix
FastPix Video Data is built for teams that don’t want a long setup story. Most teams get the Data SDK wired up in about an hour across Shaka, AVPlayer, andAndroidX Media3 (we support several other players as well), without heavy rewrites or changes to their existing playback stack.
Once the data starts flowing, teams stop debating where video might be breaking. They can see exactly when and where issues show up by device, network, player version, or release which makes it far easier to decide what to fix first and what to safely ignore.
The real advantage isn’t just how fast the setup is. Within the first hour, data starts showing up in the dashboard, and teams can see how video is actually behaving in the wild.
To know more on supported players and detailed setup steps, the FastPix documentation has everything laid out.
.svg)
.svg)


.avif)

.png)